# Uncomment and run this cell if you're on Colab or Kaggle
# !pip install sclkme
%matplotlib inline
Cell Sketching
This tutorial shows about how to use sclkme to sketch a subset of cells from a large single-cell dataset. We will use both the methods of geometric sketching [Hie et al., 2019] and kernel herding [Baskaran et al., 2022] to sketch an example single-cell dataset, and show the differences of their results. Our apis are designed to be consistent with the scanpy ecosystem.
Note: To run this notebook, you need to first install the scanpy package since we use its built-in datasets as examples.
Import packages and data
import scanpy as sc
import sclkme

sc.set_figure_params(dpi=100, color_map = 'viridis_r')
sc.settings.verbosity = 0
sc.logging.print_header()
scanpy==1.9.3 anndata==0.9.2 umap==0.5.4 numpy==1.23.5 scipy==1.10.1 pandas==1.4.4 scikit-learn==1.3.1 statsmodels==0.14.0 python-igraph==0.10.8 pynndescent==0.5.10
adata = sc.datasets.pbmc3k_processed()
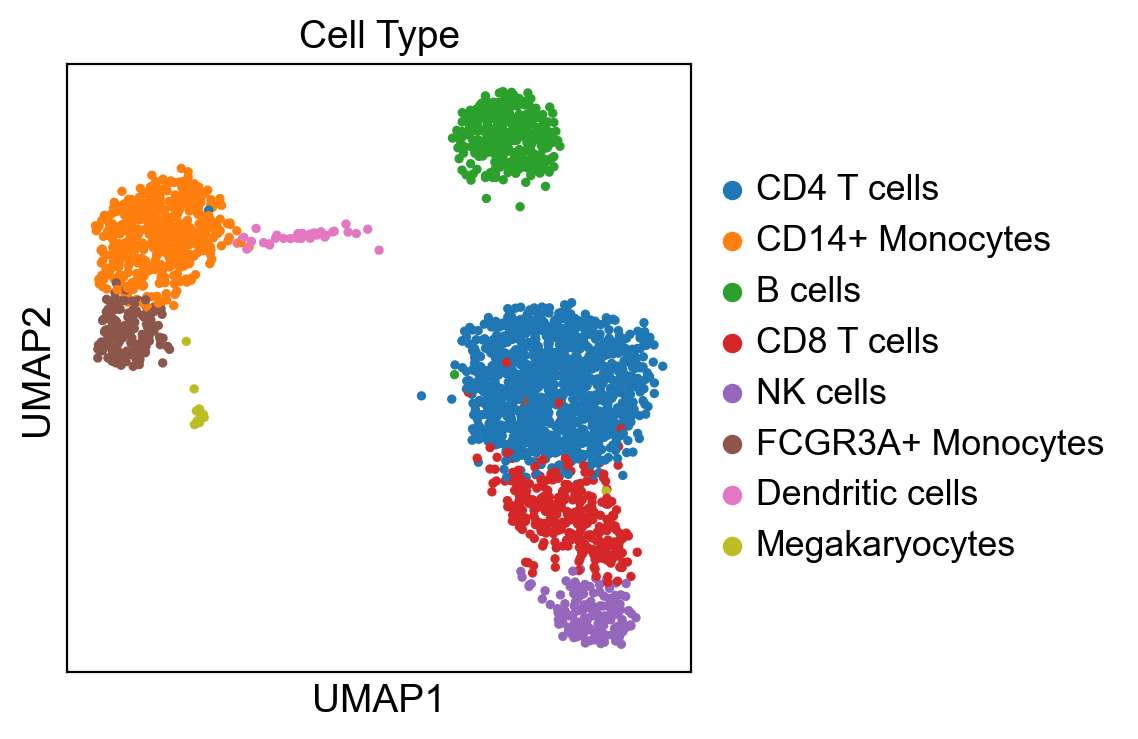
First, let’s visualize the cluster annotation of this PBMC dataset with UMAP. Cells are colored by their corresponding cell types.
sc.pl.umap(adata, color="louvain", title="Cell Type")
/Users/haidyi/Documents/proj/scLKME/.venv/lib/python3.10/site-packages/scanpy/plotting/_tools/scatterplots.py:392: UserWarning: No data for colormapping provided via 'c'. Parameters 'cmap' will be ignored
  cax = scatter(
Sketch cells using geometric sketching
We sketch the cells with 128 landmark cells, and the rep X_pca is used to run the sketching algorithm, which can save run time compared with the rep X.
sclkme.tl.sketch(adata, n_sketch=128, use_rep="X_pca", method="gs", key_added="gs")
The results of cell sketching are saved as bool varialbes in the column: {key_added}_sketch of adata.obs. In this column, the true values are the cells selected as landmark cells.
adata.obs["gs_sketch"]
index
AAACATACAACCAC-1    False
AAACATTGAGCTAC-1    False
AAACATTGATCAGC-1    False
AAACCGTGCTTCCG-1    False
AAACCGTGTATGCG-1     True
                    ...
TTTCGAACTCTCAT-1    False
TTTCTACTGAGGCA-1    False
TTTCTACTTCCTCG-1    False
TTTGCATGAGAGGC-1    False
TTTGCATGCCTCAC-1    False
Name: gs_sketch, Length: 2638, dtype: bool
# the parameters used in cell sketching
adata.uns['gs_sketch']
{'params': {'n_sketch': 128, 'use_rep': 'X_pca', 'random_state': 0},
 'method': 'gs'}
Show the sketched datasets with only the 128 landmark cells:
adata_sketch_gs = adata[adata.obs['gs_sketch']]
sc.pl.umap(adata_sketch_gs, color="louvain", size=100)
/Users/haidyi/Documents/proj/scLKME/.venv/lib/python3.10/site-packages/scanpy/plotting/_tools/scatterplots.py:392: UserWarning: No data for colormapping provided via 'c'. Parameters 'cmap' will be ignored
  cax = scatter(
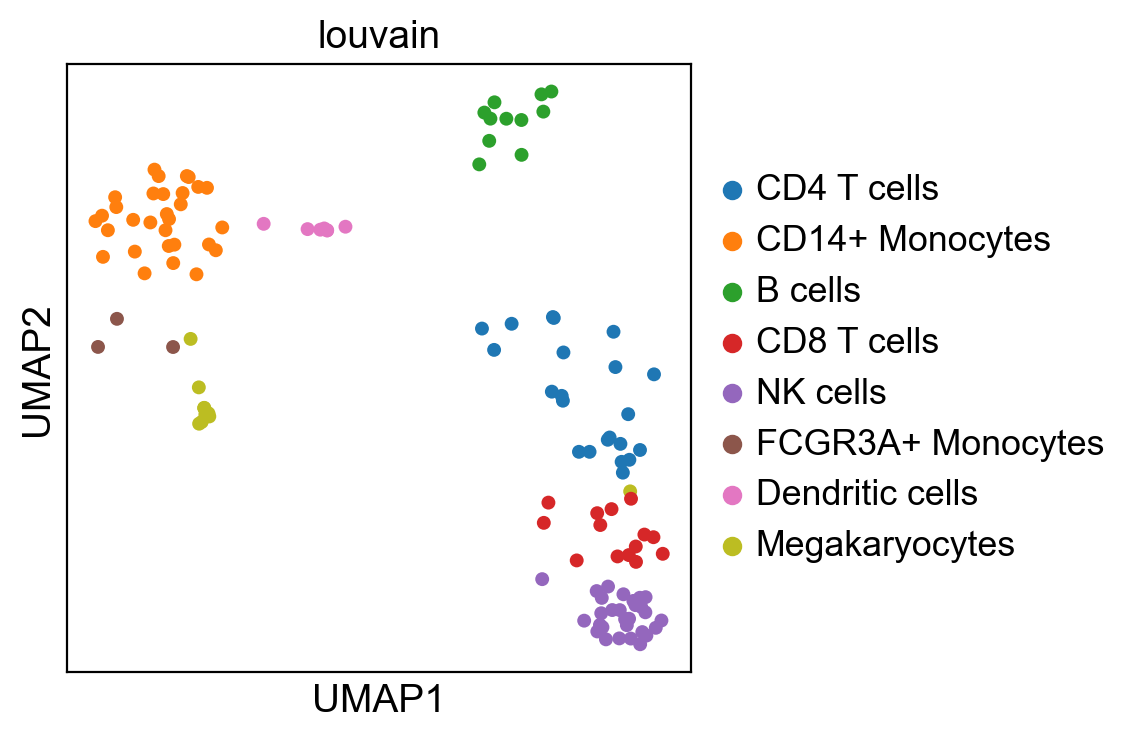
In this result, we can find that the landmark cells cover all the cell types in the original dataset.
Sketch cells using kernel herding
Here, we performe the same analysis as above but change the method to kernel_herding.
sclkme.tl.sketch(adata, n_sketch=128, use_rep="X_pca", method="kernel_herding", key_added="kh")
adata_sketch_kh = adata[adata.obs['kh_sketch']]
sc.pl.umap(adata_sketch_kh, color="louvain", size=100)
/Users/haidyi/Documents/proj/scLKME/.venv/lib/python3.10/site-packages/scanpy/plotting/_tools/scatterplots.py:392: UserWarning: No data for colormapping provided via 'c'. Parameters 'cmap' will be ignored
  cax = scatter(
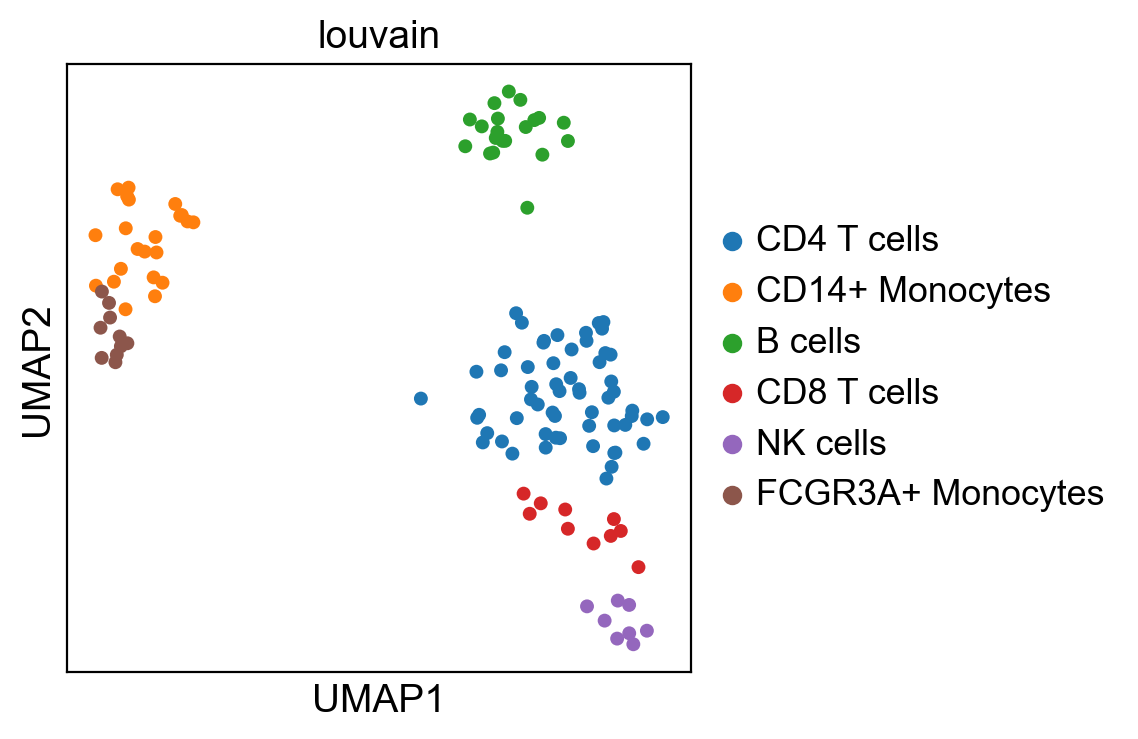
The results of kernel herding are different from that of geometric sketching. Kernel herding discards the cell types: Megakaryocytes and Dendritic since they only have a small number of cells. Compared with geometric sketching, kernel herding can better preserve the relative proportion of cell types in the sketched dataset.
Conclusion
Both geometric sketching and kernel herding can sketch the dataset with good performance. For the choice of sketching methods, it depends on some factors:
Sketching precision
Runtime efficiency